One of the main features missing in SharePoint Online is advanced Business Intelligence solutions. SharePoint On Premises has Performance Point Services but in the cloud you have to use Excel and Visio services or KPI lists/web parts to create BI solutions. This is all about to change!

I recently signed up for the Office 365 Power BI Preview. After a week or so I received an e-mail with a link to a personal demo environment. The installation and configuration went pretty fast, around 15 minutes to provision the environment. I advise to click here and follow the instructions to get started. To be honest, I am not a BI expert at all but did really like the end-user aspect of Power BI I saw in many demos and articles. I decided to write a three part series about Power BI from and end-user perspective to show you how cool it is. This is the first part so keep on reading 🙂
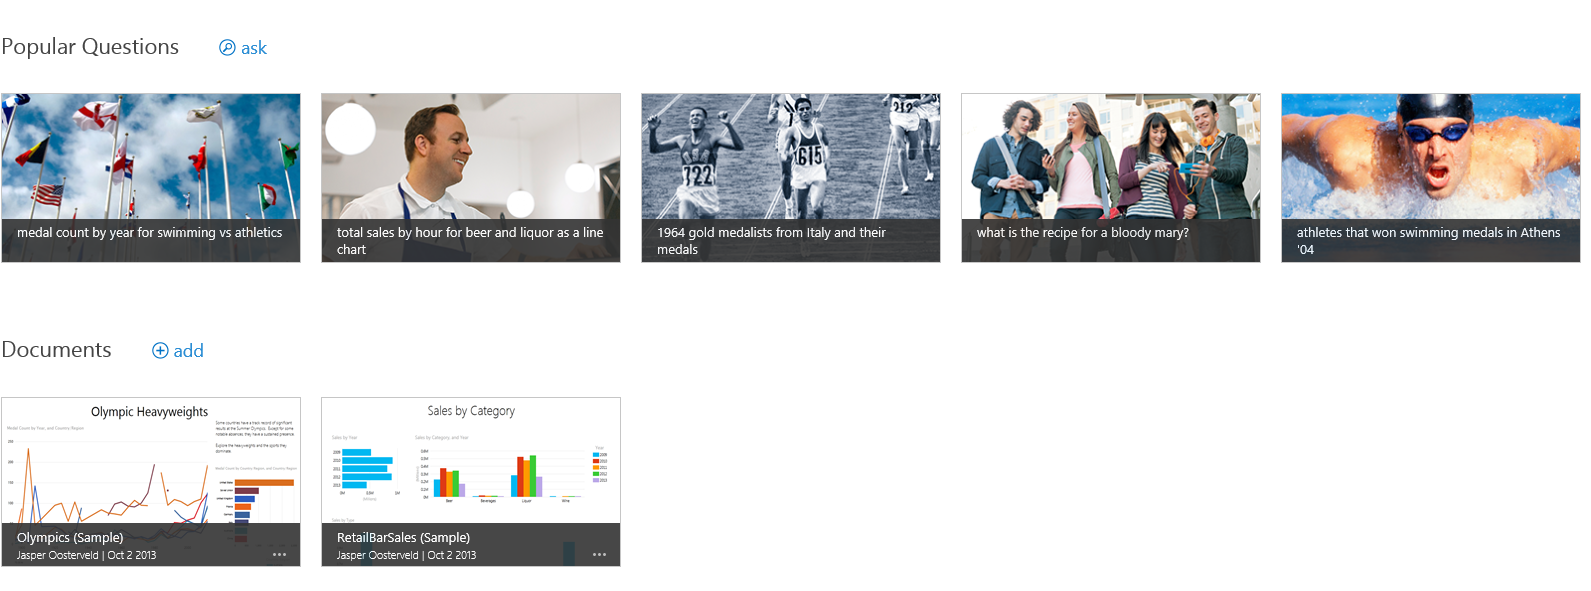
The main menu shows an overview of 5 popular questions based at the two Excel sheets you see under Documents. Let’s start and ask a question, I click on Ask:

The demo contains two Excel sheets: Olympics and Retail. A selection of questions is already present and ready to be selected. Let’s click on athletes that won swimming medals in Athens ’04:
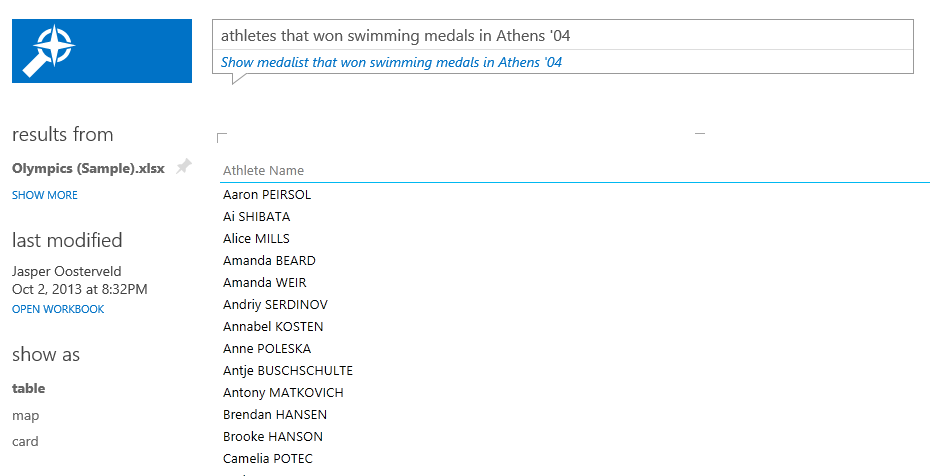
I get an overview of all the athletes. Nothing to fancy I realize but the data is correct and is provisioned really fast! Let’s look at something cooler. We go back to the main menu and click on Olympics. I am interested in an overview of the countries who won a gold medal during the Barcelona Olympics in 1992. How does this work? This cannot be any easier:
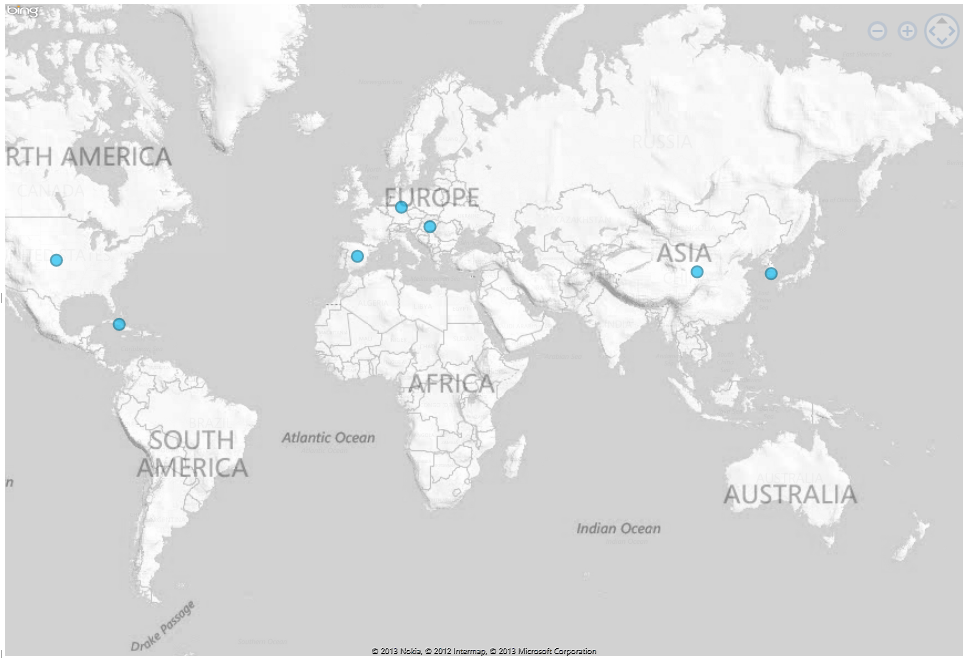
Just start typing your question! Awesome! You probably noticed the refinement panel in the previous screenshot. Let’s click on Map:

You get a nice global overview with an interactive world map. Of course you can also zoom in & out. Nothing new here but there is also a filter available on the right side of the map:

I want see the countries who won more then 10 gold medals. I change the second filter to 10 and the magic happens:
Nice! It’s fast and accurate and so easy to use for end-users. I can’t get enough of this and my geekness takes over! Let’s do one more search: what is total amount of medals per country in 1996:
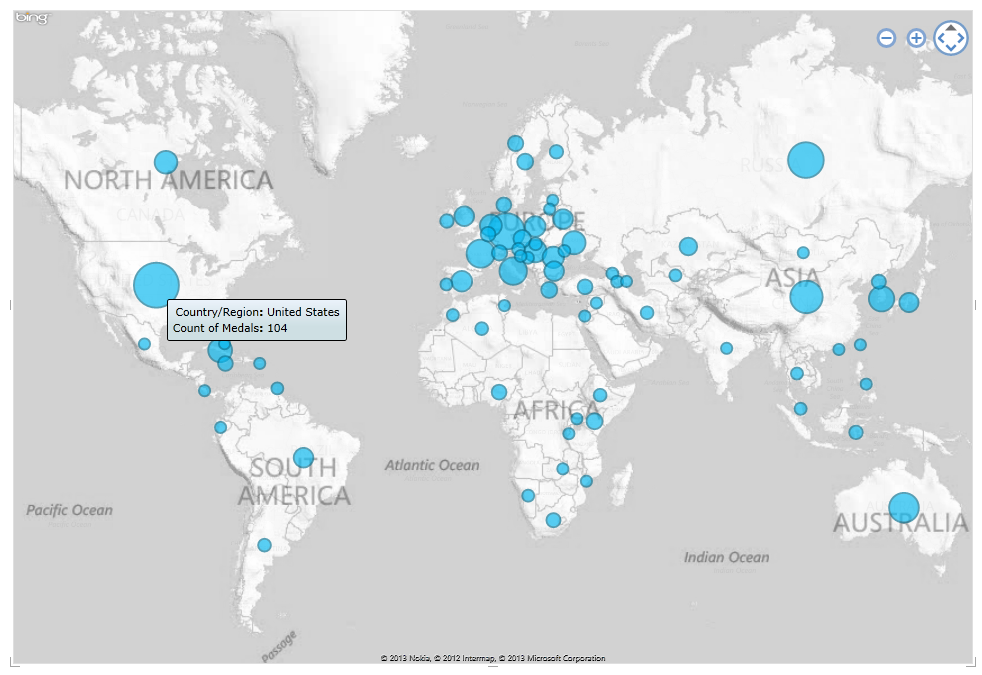
Just browse over a country to see to total amount of medals. Love it! This is really a step forward for the SharePoint Online platform and shows Microsoft is dedicated to the cloud!
The second part of this series will be about working directly with Excel documents in the browser. I am also going to explore the Power BI Windows 8 App. My ultimate goal is to understand how to build an Excel sheet with all the Power BI features.
Do you want to learn more about Office 365 and/or Power BI? You should definitely visit the following events:
European Office 365 Connect 2014 (GB263 for 10% discount)
SharePoint Connections Amsterdam 2013 (SP266 for 10% discount)
I also created a post with helpful Office 365 resources. Just click here.
Stay tuned for the second part of the series and don’t hesitate to leave any questions.
did you try connecting Power BI to an onsite datasource such as SQL server using a “gateway?” i am anxious for this to come out of preview as I have two clients that need this now!!!